The US National Weather Service’s Global Forecast System keeps track of the world’s weather. It’s an incredibly valuable repository of information, but its data, shown in DayGlo charts peppered with numbers, isn’t the easiest to visualize without a degree in meteorology. That’s where the Earth Wind Map can come in handy. It takes the the Global Forecast System’s data — updated every three hours — and applies it to a zoomable map. The result is a beautiful representation of the world’s wind in almost real-time.
Earth Wind Map turns raw weather data into neon art

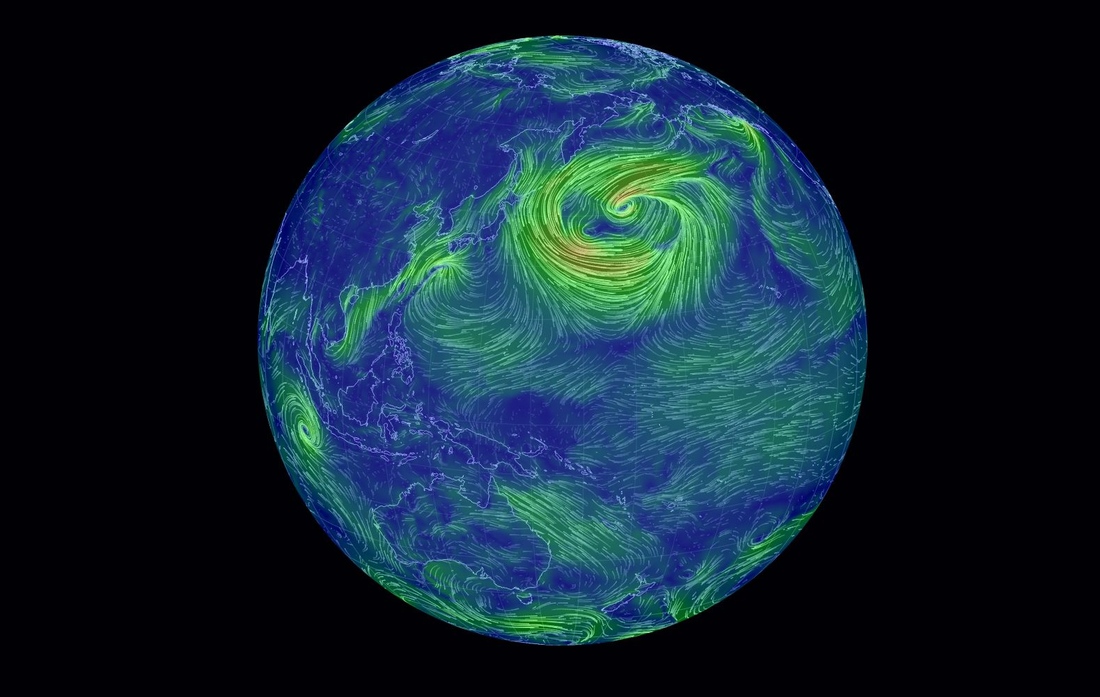
Like the US-specific wind map created by designers Fernanda Viégas and Martin Wattenberg earlier this year, Earth Wind Map is interactive. Click and drag the globe and you’ll spin it in place, then wait a few seconds before the data appears in the form of snaking lines. Gentle breezes are thin strands of green, strong winds are long streaks of bright yellow, while the strongest currents are an angry red. Take a trip around Earth Wind Map’s globe now and you’ll be able to compare the light summer winds currently wafting across northern Brazil with the swirling gusts off the north-east coast of Japan, a hypnotic and colorful reminder of our planet’s wildly changing weather.
Follow topics and authors from this story to see more like this in your personalized homepage feed and to receive email updates.
Most Popular
Most Popular
- Apple agrees to pay iPhone owners $250 million for not delivering AI Siri
- Here’s what Microsoft is offering long-serving employees to voluntarily retire
- Valve just imported 50 tons of game consoles in two days
- Google’s AI architect lived rent-free in Elon Musk’s head
- The Remarkable Paper Pure is the best digital notepad I’ve ever used


